
Example screenshots illustrating different stages of the COTEGIN workflow.
Differential Expression Analysis
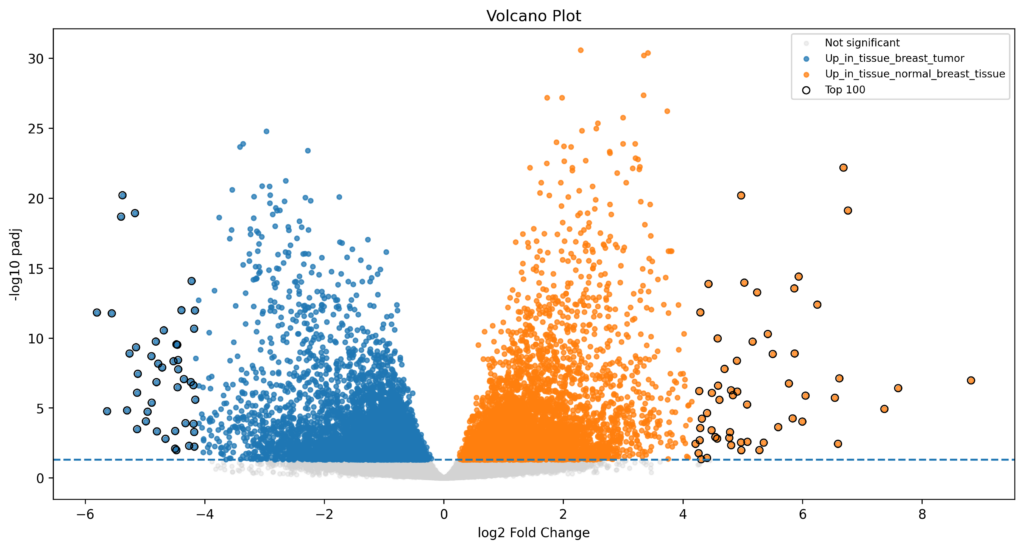
Figure 1. Example volcano plot generated by COTEGIN during differential expression analysis.
Functional Enrichment
[Imagen de enriquecimiento]
Figure 2. Functional enrichment analysis highlighting significantly altered biological pathways.
Principal Component Analysis (PCA)
[Imagen PCA]
Figure 3. Principal Component Analysis showing sample clustering according to experimental conditions.
Coexpression Network Analysis
[Imagen de red]
Figure 4. Gene coexpression network generated by COTEGIN.
Transcriptomic Rewiring
[Imagen de rewiring]
Figure 5. Differential coexpression and transcriptomic rewiring analysis.